Stock Data (EOD)

HKEX      - Ascii format
Link

HKEX      - MetaStock format
Link

NASDAQ - Ascii format
Link

NYSE       - Ascii format
Link

AMEX     - Ascii format
Link


Remarks:

  • Data will be updated at 23:50 GMT, Mon-Fri
  • HSIF5 is HSI index futures day market data
  • World major indexes are included


3rd Generation Moving Average

3rd Generation Moving Average MetaTrader indicator — is an advanced version of the standard moving average (MA), which implements a rather simple lag-reducing procedure based on the longer MA period. The method was first described by M. Duerschner in his article Gleitende Durchschnitte 3.0 (in German). The presented version uses λ = 2, which provides the best possible lag-reducing. Higher λ increases similarity with the classic moving average. The indicator is available for both MT4 and MT5. It doesn't require using any DLL.

Input parameters:

  • MA_Period (default = 50) — a period of the 3rd generation moving average.
  • MA_Method (default = 1) — method of the moving average. 0 — SMA, 1 — EMA, 2 — SMMA, 3 — LWMA.
  • MA_Applied_Price (default = 5) — applied price for the moving average. 0 — PRICE_CLOSE, 1 — PRICE_OPEN, 2 — PRICE_HIGH, 3 — PRICE_LOW, 4 — PRICE_MEDIAN, 5 — PRICE_TYPICAL, 6 — PRICE_WEIGHTED.

3rd Generation Moving Average Indicator Example MetaTrader Chart

As you see, the 3rd Generation MA (red line) offers slightly less lag than the conventional EMA (blue line) and reacts to the price changes faster. Unfortunately, it is still prone to lag and may produce false signals. You can use the 3rd Generation Moving Average Forex indicator the same as the standard moving average — to detect the current trend direction.
This indicator is used for trading in the Adjustable MA 3G expert advisor for MetaTrader.

Basic Information On Inside Day Function

Getting these free Metastock tips and online tutorial is a huge step in becoming a Metastock Expert. Read this quick guide on inside day function.
An inside day function refers to a two-period pattern that suggests a potential reversal or deceleration of the current trend. It occurs when the current period’s high is less than or equal to the high for the previous period and the current period’s low is greater than or equal to the low of the previous period. In other words, it’s where the range of the latest period is entirely nestled within the range of the previous period. Also, it’s important to note that if any of the following periods are still within this range MetaStock identifies the inside day as still existing.
SYNTAX   Inside()
APPLICATION
When interpreting the inside day it isn’t really considered bullish or bearish; rather it foreshadows a significant move or breakout. Remember however, it can provide many false signals unless used in conjunction with other conditional statements. For example:
Inside() AND
Mov(C,21,S) > Mov(C,35,S)
This formula specifies that a stock must exhibit an inside day and that the 21 period simple moving average must be greater than the 35 period simple moving average. Since an inside day foreshadows a potentially explosive move, this code isolates these occurrences wherever they exist in an uptrend. Effectively, we’ve set up our gate, and the inside day function is the trigger.

Buy Side Institutions Using Dark Pools

Most Technical and Retail Traders have heard about Buy Side Institutional Accumulation and Distribution, but few understand another institutional action which is ROTATION.
Accumulation is the acquiring of hundreds of thousands, to millions of shares of stock over an extended period of time. Quiet Accumulation is the most common nowadays which is when institutions use Dark Pools aka Alternative Trading Venues that do not show their activity on the exchanges. Buy Side Institutions are able to hide their 100,000 – 500,000 share lot activity from High Frequency Traders HFTs, Independent Investors, Retail Traders, and Small Mutual Funds and Small Pension Funds Managers by using the Dark Pool venues. This enables them to buy large to giant quantities of stock over time without disturbing price. The primary different between exchange activity and Dark Pool activity, is the ability of the Buy Side Institutions to not alter the trend that is underway at that time.
Accumulation INCREASES the amount of money in the stock market fueling Bull Markets and Uptrends, even though the Institutions buy in such a way so that price does not move much when they are buying.
Distribution is the selling of a large quantity of stock overtime, OR because of redemption demands. High redemption demands tend to occur near the end of an Intermediate Term Correction or the end of a Bear Market. Therefore Dark Pool Distribution is often faster than Dark Pool Quiet Accumulation. Dark Pool Distribution is when Buy Side Institutions sell huge quantities of stock without moving price much.
Distribution removes money from the stock market, which fuels more downside selling.
Rotation patterns occur during the mid to final years of a Great Bull Market which is a Bull Market that lasts for more than 4 years. Quiet Rotation™ is the systematic, and carefully calculated selling of shares of one stock and the buying of another stock. Rotation patterns tend to slowly bend trends either in a Bowl Bottoming Formation OR in a Rounding Top Formation. Platforms are also a common pattern for Rotation in or out of a stock.

Profit by Shorting "Most Bullish Stock"

While Day Trading, Shorting the Stock that is strongest in the day and coming out with profit confidently and easy may sound to many like trying to read computer up side down. And it is indeed like that for most traders.


What many of them lack is a robust tool  set to identify the exact point where to "reverse" or "fade" the Stock and take a reverse trade. Short trade in the case of Strongest Stock.

Superior Profit Day Traders have the tool they need for such situations. A tool set that is easy to use and unambiguous. And they used it beautifully today by Shorting Disney (DIS) as a Day Trade.
Picture
As you can see above, Media was the strongest Industry Group in DOW today (10th Aug 2016). And that was mostly due to Disney. Disney was clearly the Strongest Stock in DOW from beginning of day. Later it pulled back a bit. Still ending the day second most strong in Dow Jones Industrial Average.

In between that up move and pull back, our Superior Profit Traders easily took the Short Day Trade and profited from it.

Here is how.

Disney was in news from morning as its earnings came out and the Stock started going up strongly. Superior Profit traders looked up the Stock using easy to use ready made templates.

Below is Disney Daily chart using Clean Template. That clearly shows the potential resistance points in terms of Watermark Level (horizontal pivot levels) as well as Memory Trend Lines - very smart and automatically drawn trend lines that may come from few days back or few years back.
Picture
Traders noted that the Memory Resistance was around 99 as marked in the chart above.

​They also looked up the Weekly chart - below the Backdrop Template view of Disney using Weekly chart.  Backdrop is the usual template used to analyze Weekly charts in CUE System.
Picture
Here also, the traders noted that the Resistance Memory was at same level of around 99.

That 99 level was thus established the potential Short point for the Stock.

Now what was left was to use Intraday (5 or 10 Minute) chart using CUE Fine Tune Template to take a Short Day Trade when the opportunity came. As explained below.
Picture
Superior Profit Day Traders waited patiently for price to reach the pre-decided resistance level of 99 AND then tilt down - just enough so CUE System could draw the down arrow Stretch Release Bearish signals for him. A signal to take the Short.

With Stop just above Day's High - that Stop was never hit. Exact level of Stop was decided using CUE Protection Signal (not shown here).

The Stock fell from the Short Entry Stretch Release point and never looked back.

Some traders booked profit as the Stock went down and covered much more than the Risk amount.

Some closed the trade as Fine Tune chart showed the Bullish Stretch Release signal (up arrow) signal as marked in the chart.

If partial position was held, that was closed at End of Day. As the trade was initiated as Day Trade our traders don't usually carry it over to next day.

This was an easy Day Trade - Shorting the strongest Stock of the day. All that was needed was to find the Memory Resistance in Daily and Weekly. Patiently wait for price to come there. And let CUE System draw the down arrow Stretch Release signal to tell one to Short Disney with very narrow Stop Loss and much bigger potential profit.

A robust CUE  system essential to the trade. As was a good understanding of how to use these simple CUE Charts.

To ensure our traders are always fresh with CUE Charts, Superior Profit conducts regular Weekly Live Class explaining the system to traders all over the world.  You are most welcome to join the classes by registering here. That is if you would like to take such confident Short trades (or Long trades) - even if that is against what media is telling us at that time.

Confidently. And profiting from what we see on CUE Charts rather than following media discussions.

Day Trading E Mini S&P 500 Profitably using CUE Global

From the desk of Sagar Nandi and Superior Profit

Day Trading on E-Mini Future is possible almost 24 hours a day. Almost every day of the week.

CUE Global is a complete system that is used by investors and traders. From Long Term Investment to Swing Trade to Day Trade. All over the world.

Traders use CUE System to trade all sorts of instruments: Stock, ETF, Option, Future, Forex.

On 15th August 2016 I had posted a blog describing in detail one way I use CUE System for Forex Day Trading. You may read that Forex Day Trade blog here.

And just a few days before that; on 11th August 2016; I also posted a blog describing a real life Stock Day Trade using CUE Charts.  You may read that Stock Day Trade blog here.

Some readers requested me to post a blog on Day Trading E-Mini Future using CUE System. I am writing this blog to explain that.

CUE System techniques used to Day Trade Stock, Forex, Future, etc. are interchangeable. So all E-Mini Future Day Traders will gain valuable insight from the two blogs mentioned above. Just as Stock and Forex Day Traders will gain valuable insight from this post.

In the Stock and Forex examples, I looked at only the instrument that I was trading. I did not use correlated instruments. Instead, I looked at Longer Timeframe (Daily and; optionally; Weekly) to decide my Trade Direction and used Real Time CUE Chart to execute the Day Trade in that pre-planned direction.

That is not the only approach I use for Day Trading. Sometimes, I look at multiple correlated instruments; using same Real Time Intraday Timeframe, and then choose the one that is likely to give me the Highest Probability of Success or Best Reward Risk Ratio or both.

For E-Mini Day Trade, I often use this correlation approach. 

I will use two symbols. One is ES - E-Mini S&P 500 Future. And the other is NQ - E-Mini Nasdaq 100 Future. These two symbols are usually strongly correlated. Moving up and down together on an intraday time frame.  But not necessarily with the same force. Some days ES is stronger. And some other days NQ is more powerful. For Day Trading in the Long direction, we chose the stronger of the pair. And for Shorting, we use the weaker of the pair.

Now, what is meant by "strong" and "weak" here? Is it the different percentage moves that we see in Real Time data feed? Obviously, that is one estimate of strength. However, from a Superior Profit Day Trader's perspective, that is not the optimal way to measure force and use it in a trading decision. 

What works a lot better is to see the movement of the two symbols within a set of reference price levels or Pivots. The CUE Fine Tune Real Time template is ideal for that.

This CUE Fine Tune template is designed specifically for Day Trading. You can also use it for precision entry of Swing Trading.

Fine Tune template has automatically calculated dynamic pivot levels (horizontal dotted lines) as well as very smart auto-drawn-trendlines; Memory Lines as we call them. These provide the reference price levels to help us decide which symbol is stronger and which one is weaker.

CUE Fine Tune also has the very responsive (and thus; suitable for Day Trading) Stretch Release up/down arrow signal to decide quickly and unambiguously exactly when to enter a "reversal" trade; trade opposite to the immediately prevailing direction. 

Let us put all that together in a real life case. This Day Trade opportunity came during regular E-Mini trading hours on 15th August 2016. I will use the 10-minute chart here. However, traders can use 5 Minute or 1 Minute interval too if they choose to do that. Personally, for Day Trading E-Mini Futures, I find 5 or 10 Minute interval provides the balance between being on the trade early. So I can capture a significant chunk of the move. But not too soon that I get whipsawed often. 

Here are the charts of ES and NQ - side by side - using CUE Fine Tune template using 10 Minute interval. 
Picture
​The numbers below refers to the respective markings on the chart:

(1) I first assess which one of ES and NQ was stronger at Close on the day before. That is, at Close (4 PM EST) of the day on 14th Aug. ES had Closed somewhat below Day's High whereas NQ had Closed almost at Day's High. So, at Close, using the Day's High and Day's Close as reference levels, NQ was stronger on 14th Aug.

​(2) Next day, on 15th August, both ES and NQ opened with Gap Up.

(3) Both ES and NQ went above Early Range High and became Overbought at that level; as indicated by Stretch signal (cyan and green dots on top of the Candle).

(4) Neither instrument could continue the rally from the Overbought Stretch condition. Instead, both became weak as seen by Stretch Release signal (down arrow on top of the Candle). Both symbols displayed three Stretch Release indicator three times before they fell.

Both symbols looked similar at this point on the chart. However, there were signs that ES was weaker than NQ. For example, ES had a Candle Flow color turning Bearish magenta before NQ. Also, on the third Stretch Release Candle, ES crossed below Early Range High. However, NQ remained above Early Range High pivot level.

Using the above analysis, I concluded that ES was weaker than NQ. Both at 14th Aug Close and also after 15th Aug Open.

And therefore decided that for a Short trade, ES would be a preferred candidate.

I will now explain the Short trade execution using the ES chart below using 10 Minute Interval and CUE Fine Tune template.
Picture
​The numbers below refers to the respective markings on the chart:

(1) I took the Short trade on the third Stretch Release sign. ES crossed below Early Range High at the same time. And Candle Flow color turned Bearish magenta. These three signs together made the Short entry a High Probability Trade.

(2) I placed Stop Order immediately upon entering the trade at just above Day's High. This was a small risk amount relative to ES's usual daily move range. This Stop Level was never violated.

(3) After my entry, ES fell. And the trade Profit soon surpassed the Risk taken. I closed half position at this point.

(4) Immediately after booking partial profit, I moved Stop to Breakeven level. That is, to the Entry Price Level. Breakeven Stop was never hit.

(5)  At day's Close (4 PM EST), I closed the remaining position.

Following are the salient points of this disciplined and profitable Day Trade using E-Mini Future.

A) I selected ES over NQ for a Short trade by observing the symbols' move within CUE Fine Tune pivot levels.

B) I patiently waited for both NQ and ES to turn Bearish. And executed the trade without hesitation when multiple signals were aligned.

C) I placed the Stop Order immediately upon trade entry to manage risk.

D) I booked partial profit as soon as Risk amount was covered; making it a Risk-Free Trade from then onward.

E) I closed the entire trade at the end of the day. I had planned it as a Day Trade. And closed it as a Day Trade.

​This Day Trade was taken on E-Mini Future. However, the same technique of choosing one particular instrument from multiple correlated instruemnts for Day Trading by usign reference pivot levels of CUE Fine Tune template can be applied to other trading instruments like Stocks in similar industry, to Forex pairs etc.

Metastock 12 Review

MetaStock Professional is particularly designed for traders who use intraday knowledge to transact in actual-time in the course of the trading day. It’s appropriate for knowledgeable, lively trader and even novices to trade the markets.
MetaStock 12 bargains fantastic new options:
MetaStock Energy Console – The Energy Console takes the whole thing that’s nice about MetaStock and places it in a single handy vicinity. Now which you could open a chart, begin a scan, run a check, overview experiences, make customized lists, and extra… from one full-featured dashboard.
Full time Information on Demand – Sustaining your native information is at all times a problem. With Full-time Information on Demand, you now not want to concern about whether or not or now not you could have the most recent imaginable replace. Each time you open a chart, MetaStock hundreds the most recent knowledge for that safety mechanically. The entire newest value and extent knowledge is there, in addition to error correction and break up data.
Automatic Device and Image Database Updates – It can be by no means been more uncomplicated to maintain the newest, finest model of MetaStock for your laptop. Tool enhancements replace robotically as they turn into on hand. Additionally you now not need to consult with our web page to replace your image database. It updates periodically with the press of your mouse.
International Information for All Customers – While you buy or rent MetaStock Professional you get the facility of MetaStock XENITH . So along with actual-time information and information for the areas you opted to obtain, you get delayed information for each area they deals. For more information on tips on how to get knowledge in Metastock instrument talk over with here.
Currency Conversion – Want to view you favorite US security in Euros? No problem. With MetaStock Pro 12, you can convert in real time the currency in any or all of your charts with the current exchange rate.
List of inbuilt line studies that MetaStock includes:
Andrews’ Pitchfork
Cycle Lines
Ellipse
Equidistant Channel
Fibonacci Arcs, Fans, Retracements, Projections
Fibonacci Time Zones
Gann Lines, Fans, Grids
Linear Regression Trendline
ODDS™ Probability Cones
Quadrant Lines
Raff Regression Channel
Rectangle
Speed Resistance Lines
Standard Deviation Channel
Standard Error Channel
Tirone Levels
Trendlines
Triangle
Minimum System Requirements:
Operating System – Windows 7 / Windows Vista / Windows XP
Processor – Intel Core 2 Duo 2.4 GHz or higher
RAM – Minimum 2GB RAM, Recommended: 6GB RAM
Video – Video card and monitor supporting at least 32-bit color at 1024×768 or higher
Hard Disk – 1GB of Available disk space
Internet Connection – Broadband / High-speed Internet connection

Backtesting Of A FOREX Robot Or Forex Expert Advisor

To get essentially the most out of your skilled guide, you’ll want to optimize and backtest your strategy the use of MetaTrader’s Technique Tester. Whereas ahead trying out on a demo account is very important, backtesting lets you simulate trading over a protracted time frame in simply minutes. And with the optimization characteristic, one can find out which settings carried out very best over a particular historic chart length.
There may be substantial debate over the accuracy of MetaTrader’s strategy tester. At highest, backtesting deals handiest a detailed approximation of how trades can be carried out in actual-time. However it’s the one device on hand to swiftly take a look at any strategy over a variety of trading eventualities, and one that you simply must learn to use smartly.
Please, don’t disregard to prompt your demo or actual account, despite the fact that you best want to backtest any FOREX Robotic! In case you want to do backtesting WallStreet FOREX Robotic, first you must obtain historical past from the MetaTrader historical past middle: click on Instruments -> Historical past Heart, or press the “F2” key of the keyboard. Within the checklist, to find the currency pair that you simply need to again-check and double click on to amplify it. Click on “1 Minute (M1)” after which click on “Obtain”. When the obtain course of is completed, double click on on “5 Minutes (M5)” and “15 Minutes (M15)” to transform the M1 information. Shut the “Historical past Heart” window.
backtesting
To open the “Strategy Tester” window click the “Strategy Tester” button of the MetaTrader menu, or press “Ctrl+R” on the keyboard. In the “Strategy Tester” window chose your forex robot like “Forex Black Magic Robot” or any other robot you want to back test, chose one of the supported currency pairs (EURUSD or GBPUSD), chose M15 timeframe or your desired timeframe, chose the method “Every tick …”, as shown below. Click “Start” to start the backtesting.
Dynamic S&R
The backtest by means of “Every tick” is essentially the most exact, however it is rather gradual. In case you want to retailer time that you can run the backtest on M1 timeframe by way of “Open worth handiest …” manner and this will likely be right too.

Analyze the key to get free data for commodity exchange in Metastock and Amibroker structure

On this quick tutorial you’ll research the methods of getting free finish of day knowledge for commodity exchange in Metastock and Amibroker structure. Under the publish you’re going to in finding hyperlink to Knowledge Downloader a pleasant free utility developed by using Joydeep. Kindly obtain Knowledge Downloader and unzip it. Now run Information Downloader exe file via clicking on the information downloader icon.
commodity exchange
As soon as it runs make a selection Settings –> Choose Knowledge Paths and put the MCX EOD folder for your Information Downloader folder. As soon as your knowledge direction is ready click on Obtain –> EOD Information –> MCX EOD. Make a selection present 12 months or archive 12 months and put the dates you need to obtain the information for. Now click on on the large obtain button and it is going to begin downloading free finish of day knowledge for commodity exchange. As soon as the obtain of free information for commodity exchange is finished shut information downloader and open the MCX EOD folder. You’ll see ascii recordsdata at no cost knowledge for commodity exchange is now existing within the folder. Shut the folder.
Now open The Downloader of Metastock. Click on Instruments –> Convert. In supply put, file kind ASCII, Folder make a selection the folder MCX EOD within the Information Downloader folder and file identify choose the recordsdata you simply downloaded by way of Knowledge Downloader. In vacation spot, file kind Metastock and folder make a choice any folder that you wish to have to make use of to maintain your Metastock knowledge. We advise you to create a brand new folder to maintain Metastock knowledge for commodity exchange. Click on choices and in date vary put dates of the information downloaded. In first date put the date of the primary day of the info and within the ultimate date we recommend you to make use of nowadays’s date. In periodicity be sure it’s day-to-day. Now click on on good enough and once more click on on good enough.
Now you are going to see the commodity exchange information is getting transformed in metastock layout. As soon as it’s finished shut the downloader and run Metastock. Now see you will see that commodity exchange knowledge for your Metastock.
commodity exchange
To import the information into Amibroker please create a brand new database and pull the information the usage of the Metastock information plugin. Or that you can immediately import the commodity exchange information in Amibroker the usage of the import ascii possibility.

Write Your Own Simple Metastock Stop Loss Formula

What’s a trailing cease loss?
A stop-loss order set at a proportion or outlined degree under the market worth – for an extended place and a cease-loss order set at a share or outlined degree above the market value – for a brief place. The trailing cease value is adjusted as the cost fluctuates. The trailing cease order can also be positioned as a trailing cease restrict order, or a trailing cease market order. That is any such useful gizmo, but many fail to make use of it. The usage of a trailing cease means that you can let earnings run whereas slicing losses on the comparable time.
On this article we will be able to attempt to write our personal Metastock cease loss system, an broadly used charting platform. First allow us to take a look on how the indicator could seem like and the way we are able to use it. We all know one image price a thousand phrases, so please appear the beneath picture in moderation to have in mind the utilization of the Easy Path Cease Loss Indicator.
Metastock stop loss formula
Now run your Metastock. Then Tools –> Indicator Builder (or Ctrl+B). Select New. This will open up the Indicator Editor window in front of you. In the name put Simple Trail Stop Loss and in the formula put the following code:
Stop1:=If( PREV = PREV,
( H – 4.5*ATR(14) ),
PREV),
( H – 4.5*ATR(14) ));
Stop2:=If( PREV = PREV,
( C – 3.5*ATR(14) ),
PREV),
( C – 3.5*ATR(14) ));
StopLong:=If(Stop1>Stop2,Stop1,Stop2);
Stop1:=If( PREV > H,
If(( L + 4*ATR(14) ) H,
If(( C + 3.5*ATR(14) ) <= PREV,
( C + 3.5*ATR(14) ),
PREV),
( C + 3.5*ATR(14) ));
StopShort:=If(Stop1<Stop2,Stop1,Stop2);
If( ((Year()<=2012) OR (Year()=2050 AND Month()<=6 AND DayOfMonth()<=31)),
If((BarsSince(LBarsSince(H>Ref(StopShort,-1)) ),StopLong,StopShort),C);
Now click on Apply and Ok and voila you are having this nice Metastock stop loss formula ready in your indicators list. Now load this Metastock stop loss formula indicator from Insert –> Indicators (or Ctrl+I), select the Simple Trail Stop Loss indicator and apply it to Inner Window #1, ie. where your price chart is there.
One important thing to note, what is the use of this line (Year()<=2012) OR (Year()=2050 AND Month()<=6 AND DayOfMonth()<=31). Actually I have tried to limit the usage of this indicator upto 31st December 2050. You can similarly limit usage of any indicator till a specific time limit while sharing with your friends or colleagues.

Rahul Mohindar Oscillator And RMO ATM Add-on Overview


Rahul Mohindar Oscillator and RMO ATM is a invention of Rahul Mohindar of VIRATECH. After the very neatly obtained Rahul Mohindar Oscillator, i.e RMO variation (which used to be launched with MetaStock 10 in 2006), there have been a couple of requests from customers, for extra instruments and insights of Rahul’s work. This new add-on is an effective way to get you up to date along with his findings and likewise to take your diagnosis to the following stage.
The RMO ATM add-on targets at making prognosis much more easy and methodical. It comes pre constructed with clear, crisp and neatly built-in buy and sell methods which have been in a position to surviving one of the most most excessive market scenarios.
Within the Rahul Mohindar Oscillator setup this RMO ATM involves you bundled with the next
6 Warning signs
ATM RMO II +
ATM RMO II –
ATM Breakout Catcher
ATM Counter Trend Indicator
ATM Zone Detector
ATM Zone Fill
Four Templates
ATM RMO II
ATM RMO I & II Twin View
ATM Counter Pattern Indicator
ATM Breakout Catcher
Three Consultants
ATM Counter Pattern Indicator
ATM Breakout Catcher
ATM RMO II : for Complete Commentary
7 Explorers
ATM Counter Trend Indicator BUY
ATM Counter Trend Indicator SELL
ATM Breakout Catcher BUY
ATM Breakout Catcher SELL
ATM RMO II +
ATM RMO II –
ATM RMO II = zero
2 BONUS Explorers for the prevailing RMO Variation
ATM RMO Built-in BUY
ATM RMO Built-in SELL
ATM : Breakout Catcher
The ATM : Breakout Catcher indicator solves the trend puzzle straight out. For ease of interpretation we counsel plotting it in histogram model.
Discover within the illustration above that the indicator oscillates between -1 and +1. That you can become aware of trend modifications appropriately without a lot of a lag impact the use of this indicator. +1 signifies Energy and this makes you trade on the lengthy aspect. Because the trend develops and will get more suitable and steady the indicator stays above +1 and on a regular basis creates a sequence of sure histogram ticks. Each sure uptick will have to no longer essentially be interpreted as a buying probability.
The indicator at zero would point out that the stock has retraced with regards to value / time from its current trend. The zero valuehence means that the stock has entered Impartial mode and does now not suggest a recent trade. Then again aggressive traders may just like to make use of this Impartial mode innovatively to place on trades with a smaller chance and are expecting a better reward.
-1 signifies weak point and implies trading on the brief aspect. Because the trend will get weaker and costs continues to say no you’re going to incessantly discover that the indicator stays persistently at -1 making a collection of poor histogram ticks. As soon as once more, each poor tick will have to no longer essentially be interpreted as shorting probability.
ATM Zone Detector (ZD) and ATM Zone Fill (ZF)
As soon as of the best fears of an lively trader is the concern of getting caught in a trade which ends bad as a result of
sideways or subdued value and quantity motion. It’s of serious significance that we observe and trade indicators which might be backed with each value and quantity motion.
rahul mohindar oscillator
In the Rahul Mohindar Oscillator setup ATM Zone Detector (ATM ZD) and ATM Zone Fill (ATM ZF) do exactly this and mark out the Zone we are trading in. We recommend you first plot ATM Zone Fill (ZF) in histogram style and then overlay the ATM Zone Detector (ZD) on top of it (Merge with scale if prompted). An easy way to view this is to apply the ATM Breakout Catcher template.
In the Rahul Mohindar Oscillator setup ATM ZD and ZF clearly classifies a chart into 3 defined zones….
Dormant Zone: When both ATM ZD & ATM ZF indicators show a value 0. We should avoid taking fresh breakout type trades in this zone.
Active Zone: When at least the ATM ZD shows a positive value (ATM ZF may not). Breakout signals should yield positive results in such cases.

Hyperactive Zone: A zone where both, ATM ZD and ATM ZF are positive. This shows that the chart is backed with both good volumes and above average price volatility. A fresh trade / signal in this zone can be considered well confirmed and has a good potential in terms of delivering a profitable move.


Turtle Trading System Metastock Indicator


Turtle trading is a most famous trading system; I wrote a series of articles to provide the elemental principles of turtle trading system. In this article, I will provide you with just a few examples on the best way to practice the turtle methods in your trading through utilizing MetaStock.
One of the most as a rule used tools for MetaStock is The Explorer, with this tool traders can clear out securities that don’t healthy any given standards. The factors can be defined through writing MetaStock system as the next example.
According to the turtle buying and selling process, the shorter term entry process centered on a 20-days breakout. Merchants can effortlessly write a turtle trading system metastock formula for every day charts as follow.
H > Ref(HHV(H, 20), -1) OR L < Ref(LLV(L, 20), -1);
H = Today’s high; L = Today’s low
HHV(H, 20) = Highest value that the high price (H) has reached in the previous 20 days.
LLV(L, 20) = Lowest value that the low price (L) has reached in the previous 20 days.
Ref(HHV(H, 20), -1) = The highest high price in the last 20 days refer to last day.
Ref(LLV(L, 20), -1) = The lowest low price in the last 20 days refer to last day.
If merchants desire a record of securities that fit the turtle exit procedure, 10-days low for lengthy positions and 10-days high for short positions. The formulation will probably be as comply with.
L < Ref(LLV(L, 10), -1) OR H > Ref(HHV(H, 10), -1);

These are examples of the best way to apply buying and selling methods by utilizing turtle trading system metastock formula. Besides The Explorer, traders may write the formula in other instruments corresponding to expert advisor or Indicator Builder as well.


恆生指數期權攻略

恆生指數期權攻略 第 一 篇

期權認識


先簡單為大家介紹一下甚麼是期權, 為何要認識?


期權:

期 - 指一個期限, 一段時間之內
權 - 是一個權利. 行使權利.

例如:

甲乙雙方簽訂一個合約, 甲同意收取乙方 50元, 讓乙在 30 天內的任何一天,
用 10 元一個杯的價格, 買入 (或賣出) 1,000 個杯.

所以乙就有這個權利在30 天內的任何一天, 去行使這個權利.

而甲則要在乙行使權利時, 必需履行合約.

********

是不是產生了一個問題, 這種合約對雙方有甚麼好處 ?

在甲方立埸, 市埸的杯是 10 元一個, 甲收取乙 50 元費用,
不管乙方到時要多少杯, 在市場買給他就是了.
對於甲來說, 平白就賺取了 50 元, 何樂而不為 ? 是不是很精明 ?
這 50 元 差不多是保險金形式.

但對於乙來說, 則不是這樣看.
乙覺得在這 30 天內, 杯子價格會上漲(或下跌), 但又不太肯定.
乙用 50 元當作保險金, 萬一杯子價格真的波動, 那麼仍何用預算中的合約所訂價 10 元去行使購買 (或賣).

至於乙為何又這麼笨, 不直接在市場先買入(或賣出) 1,000 個杯, 卻要多付 50 元再之後才買 (或賣)呢 ?

原因有很多, 乙可能暫時沒有那麼多資金, 要在 30 天內才有.
不想在市場沽貨, 仍看好後市.

而當中更複雜的內情是: 原來乙收取丙 100 元一個合約, 所以他用 50 元把這個合約風險轉給了甲.
他可是穩賺了 50 元.

而乙卻不是最精明, 因為丙是以 500 元一個合約賣給丁的. 所以丙的穩賺是 400 元一個合約.


*********

上面的例子又有兩個問題了, 甲由精明變成最笨, 收那 50 元卻要冒大風險.
而丁卻為甚麼願付那麼高價去訂這合約 ? 直接去買入 (或賣出) 那些杯不是更好嗎 ?


卻原來還大有文章, 原來甲是杯子的大生產商, 控制著杯子的市場價格. (假設來的)
所以在他跟乙簽訂合約後的 30天, 把杯子的價格都控制在 10 元以下 (或以上)

變成了乙在 30 天內, 直接在市場買賣比行使權利更好, 於是乙肯定放棄行使.
而甲則穩賺 50 元了.

而當然從上例中, 看見乙其實也不是想買賣杯子的, 他衹是賺取丙的合約差價 50 元.
他也在到期前達到了穩賺 50 元

至於丙, 因為用100 元買入這權利, 再用 500 元轉手給丁, 於是他也穩賺了 400 元

關鍵就來了, 丁幹嗎用 500 元去訂這種合約呢 ?


原來更大的內情還在後頭.....(待續)


**********


恆生指數期權攻略 第 一 篇 (續)

期權認識


丁是不是很笨 ? 丁是否白白付了 500 元.

不是, 丁一點不笨, 他還賺了大錢.

因為丁早在市埸的杯子價格處於 5 元時, 就不斷收集, 收集了的現貨可能比甲還多. (也可以相反是從高價一直沽貨)
以丁現時持貨的數量來看, 他知道一下子推到市場上, 肯定影響杯子價格下跌.
這祇是很簡單的供求關係價格波動, 在此不細述.

於是丁明知道一旦大量杯子推出市場, 會令價格下跌.
他便在未推出現貨時, 先在市場尋求願意接手的買家 (或賣家)
以合約形式去訂明期限內, 用固定價格成交.

那為甚麼丁又不直接找甲用 50 元購入這行使權利, 卻又願多付 450 元去買入行使權呢 ?

試想, 甲一年祇可生產 10,000 杯子, 而市場可消化大約 8,000 至 9,000 杯子,
而丁卻囤積了 10 萬杯子.

丁這些杯子是他過去慢慢從市場中收集的, 平均價在 7 元之間.
而現時市價是 10 元, 當然他推出一百只或二百只, 是不太影響市價的.
但要一下子套現的話, 市場定必消化不來, 而令價格下跌.

所以丁在決定套現時, 就更不能將銷貨行動外洩. 特別是甲.
於是丁隨了用第三者身份向甲買入行使權利之外,
亦同時在期權市場中向乙, 丙等以高價搶入這些行使權.
務求在甲未察覺異動之前, 取得足夠行使權合約.

如果事前讓甲知道了, 豈不獅子開口 ?
好吧, 簽一個 10 元 買/賣 1,000 杯子的行使權, 5,000 元一張
因為風險太大了.

這樣丁就無利可圖了.


**********


從以上我們大概知道了期權市場有那些人物, 及期權市場的作用.

現在讓我整理一下, 把那些代入人物表達出來.


甲: 就是期權市場的莊家.

要達到期貨交易所指定條件的, 才可出任期權莊家.
包括必需定時報價.

而任何投資者亦可扮演莊家角式, 衹要每一張合約有足夠按金.
並得隨時在市況波動時補倉, 增加按金.
而風險理論上是無限大的. (沽出認購)
而沽出認沽則最大損失是所有價下跌至 0

莊家的最大利潤衹限於所收取的期權金.


乙, 丙, 丁 : 都是期權參與買賣者

期權參與買賣者, 假如購入的是認購期權, 利潤理論上是無限大的.
而購入認沽期權則最大利潤是所有價下跌至 0

不論購入的是認購或認沽期權, 最大損失是所有期權金.


杯子: 等同股票, 指數, 也可以是任何商品.


**********


恆生指數期權攻略 第 二 篇


為何要認識期權 ?


一般有買賣股票的都知道, 買入一隻股票. 要待價位上升後沽出才可獲利.
但有部份更精明的, 已懂得沽空股票獲利.

註: 沽空就是手上無物, 先借貨在市場沽出, 待價位下跌之後.
再於市場買入. 把股票歸還所借數量之後, 獲取差價.

但在股票沒有波動時, 即不升不跌. 則不能獲利了.


而期權則不同, 它的獲利方式可以如下:

1) 價格上升
2) 價格下跌
3) 不升不跌

同時期權高手的組合中, 更可細分為:

1) 先升後跌
2) 先跌後升
3) 狂升暴跌

不管你是從投資角度, 投機心態, 甚至視為賭博.
都是最公平的獲利工具.

衹有任你選擇方式的, 才稱得上公平.

然而有公平的投資工具, 卻不代表你穩賺不賠.

要在期權市場獲利, 同樣要對市場有所認識.
保持你的市場觸覺, 有自己的分析能力.

在未教大家如何分析市況前, 下一篇就會教大家如何買賣期權.
用甚麼方式及策略去買.


**************


恆生指數期權攻略 第 三 篇


如何買賣期權 ?


甚麼人可以買賣期權 ?
一般人都可買賣期權


買賣期權需要很大資金嗎 ?
不一定, 價外期權(註1)就低至幾百元即可買賣

註1: 價外期權是指跟現時市況的指數有差價或很大差價.
例如: 恆生指數現時是 20000 點
那麼同樣是 20000 點的認購或認沽期權, 就叫等價期權.
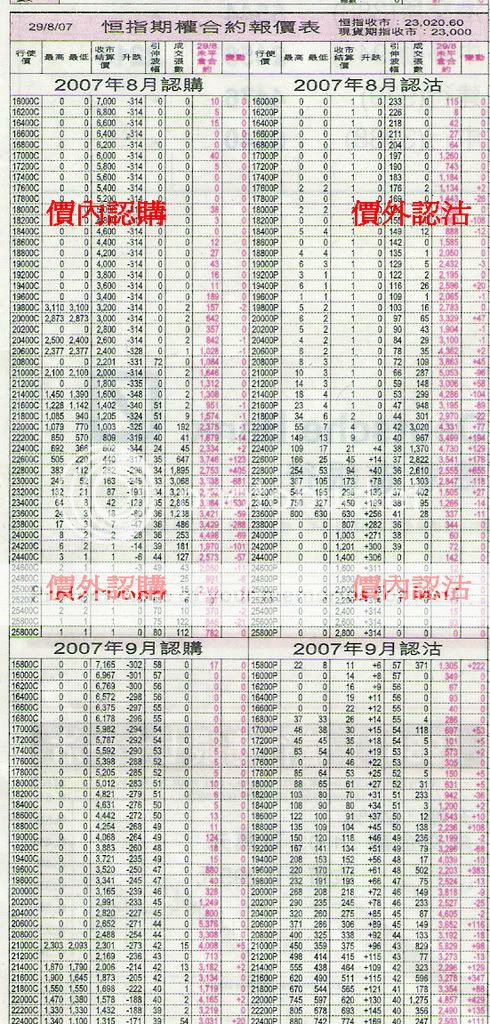
而低於 20000 點或更低的認購期權, 叫作價內認購期權.
高於 20000 點或更高的認購期權, 叫作價外認購期權.

相反,
低於 20000 點或更低的認沽期權, 叫作價外認沽期權.
高於 20000 點或更高的認沽期權, 叫作價內認沽期權.

跟現時指數相差很大的, 例如 30000 點, 或 10000 點的認購或認沽期權
統稱為極價外或極價內期權.

看下圖摘錄自 2007-08-30 經濟日報 投資版 期權報價


在那裡可買賣期權 ?
在期貨交易所指定的期貨經紀開設帳戶, 即可買賣.
買賣方式可用電話, 或網上交易系統.


如何得知期權報價 ?
期權不像股票普及, 所以各類報章的投資版, 較少篇幅報道.
而較為詳盡的, 要算經濟日報的投資版.
但要得知最詳盡的報價, 及即市現況最新報價.
則必需透過股市大利市的期貨交易報價系統.
或以電話向你的期貨經紀查詢.

亦可在香港交易所查看每日市場報告 (只有英文版)
香港交易所
http://www.hkex.com.hk/data/derivativesmarket_c.htm

每日市場報告
HANG SENG INDEX OPTIONS DAILY MARKET REPORT
http://www.hkex.com.hk/futures/futuresdayrpt/hsio070831.htm


如何認識報價 ?


買賣期權分 4 種方式, 分別是:

1) 買入認購 Buy call
就是看市況上升, 付出期權金. 利潤無限. 最大虧損僅限於期權金

2) 買入認沽 Buy put
就是看市況下跌, 付出期權金. 利潤最大為所有下跌幅度. 最大虧損僅限於期權金

3) 沽出認購 Sell call
等同莊家, 同樣是看市況下跌, 收取期權金. 利潤最大為收取的期權金. 最大虧損無限.

4) 沽出認沽 Sell put
等同莊家, 同樣是看市況上升, 收取期權金. 利潤最大為收取的期權金. 最大虧損所有下跌幅度.


期權莊家必需有足夠按金, 按金一般跟期貨指數按金相若. (大概每張合約 8~10 萬)
並得隨時在市況波動時, 按期交所指定補倉. (補倉即增加按金)


打開下圖看看, 是否明白當中報價.


下圖紅圈, 2008年 6月. 11600 P 認沽, 價值 20 點(即1,000元)
因為這裡報價範圍有限, 但可推斷 11600 P 以下的, 則不值 20 點.
假如買入又如何獲利呢 ? 是否要等大市跌至 11600 點以下才獲利 ?
這些在下篇同樣再為大家說明.


而在期權市場中, 我們常聽到 - 時間值 及 引伸波幅
那又是甚麼呢 ? 在下一篇中, 你必需留心學習.


推薦參考期交所
恒指期權的常見問題

http://www.hkex.com.hk/invedu/invgallery/common_questions_c.htm


恆生指數期權攻略 第 四 篇


時間值 及 引伸波幅


這個大家必需認識, 這正正是我教大家一些本金不多的朋友,
利用時間值 及 引伸波幅 可以參與的重要環節.


時間值 - 就是時間的價值
一個期權合約是有到期結算的一天.

我舉個例子:

現時恆生指數是 20000 點, 假如你看好買入一個價外期權.
行使價是 28000 點, 價值 10 點 (500元)

但你買入的是現貨月 (即月)
而時間衹剩下 5 天便結算.
那麼你試想一下, 在 5 天時間內, 升上 28000 點, 即是要升 8000 點.
有可能嗎 ?
當然可能性就很低, 所以這個期權的價值, 就會隨著時間消失.
而令到可能性越來越低, 它的價值於是消失得很快. 甚至一文不值了.

又假設買入一個更遠期的價外期權. (看下表 2008-06 月認沽, 這是真實報價 期交所 2007-08-31)


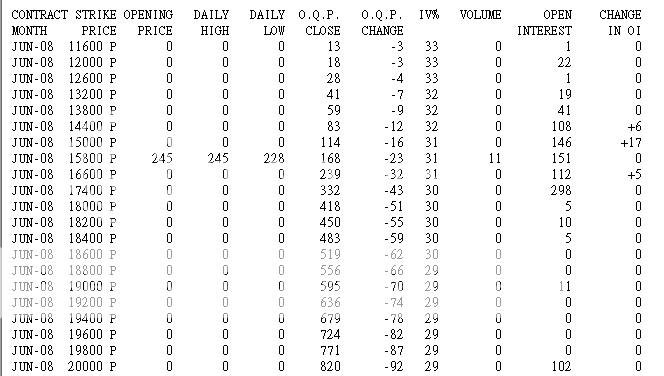
11600 P 價外認沽期權, 價值 13 點 (650 元)

現時恆生指數是 23000 點, 相差 11400 點.
但時間卻有差不多 10 個月

那麼你又再試想一下, 未來 10 個月內, 恆生指數會不會衹升不跌 ?
就算衹升不跌, 但仍不可抹煞下跌的可能, 因為仍有 10 個月的時間.
很多不可預料的事都會發生. 所以它的價值仍然存在.
這就是時間值 - 時間的價值


當然在實際買賣中, 買入 11600 P 價外認沽期權, 就不一定是看未來恆生指數會下跌至 11600 或以下.

因為衹要從 23000 點跌至 20000 點, 那麼這個距離, 就跟 11600 相近了一點.
而它的價值也因此而上升.
在它的價值上升時, 也可以隨時把它沽出獲利, 而不必等到 2008-06 月到期日.


至於 引伸波幅, 就是從大市的波幅引伸出來的影響, 就叫 - 引伸波幅

它有甚麼作用呢 ?

試想, 你買入了一個期權合約, 不論是看升或看跌.
假如大市天天不升不跌, 又或衹是輕微上升和下跌.

那麼對於一個價外期權來說, 是最不利的.
因為沒有大波動, 距離目標行使價就遙不可及.

期權金的價值也因此而降低.
但另一方面看, 卻是購入期權部署的最佳時機.


*************

下一篇預告:
不必推測短期大市走向, 大市升跌皆可獲利.


*************


恆生指數期權攻略 第 五 篇

不必推測短期大市走向, 大市升跌皆可獲利.


如果在賭場, 大家同時下注在 大 和 小
那真的自尋煩惱, 有輸沒贏.
都不用多解釋吧. 開個圍骰便賠清光.

而最重要的一點是: 一賠一
換然之不論開大或開小, 你所贏取的一注, 衹能成和局.

但在期權市場裡, 卻不盡相同.
因為它獲利的情況不同, 一可博無限.

舉例:

恆生指數在 20000 點 , 不推測其走向, 但推測未來市況極為波動.

那麼買入一個遠期極價外認沽期權價 及 一個遠期極價外認購期權.

價外認沽期權假設行使價是 10000 點 價值 10 點子 = 500 元
價外認購期權假設行使價是 30000 點 價值 10 點子 = 500 元

好了, 假設恆生指數在這一年都不升不跌, 那麼到期時, 就輸光 1,000 元
但我跟你說, 恆生指數在這一年都不升不跌, 有這可能嗎 ?
也是有的, 牛皮市. 就是一天升, 一天跌. 極之沉悶.
但這樣的牛皮市多見嗎 ?
那就關乎到技術分析及基本分析了. 這是後話, 後文再續.


但如果當時是波動市況;
或者正確一點說, 就是有足夠分析是處於波動市況.
才會進行這個策略性組合.

衹要恆生指數在這一年之內, 任何時候. 升跌幅超過 5000 點的話.

結果就是一個期權不斷升值,
但另一個期權會跌價, 但未必全跌.
因它仍有時間價值存在. 除非已接近到期日, 時間價值已消失.

上面的例子, 是完全真實例子.
一個本來衹值 500 元的價外期權, 因為恆生指數不斷上升, 或大幅下跌.
而令到本來極價外的期權, 變為價外或甚至等價期權.
其內在價值也因此從 10 點子升至幾百甚至1000 點過外
要知道 1000 點就是 50,000 元了.


但我提醒各位, 賺錢還沒那麼快.
期權的組合可謂千變萬化.

在高手的組合裡, 它可以買入價內認購, 沽出價外認購去降低成本.
亦等同不用付出十萬八萬按金. 因期交所接受對沖方式買賣.

這裡恐大家混亂了, 再溫習一下.

沽出認購或認沽期權, 是等同莊家.
不同於買入認購或認沽期權的, 不要搞混了.


*************


下一篇大家就要認識一下甚麼是對沖和套戥了.
你又知不知道, 套戥幾乎接近 100% 必賺不賠的呢 ?


恆生指數期權攻略 第 六 篇


對沖和套戥


在投資市場, 我們經常聽到這兩句術語.
到底有甚麼作用 ? 以及對投資者有何啟示性.

那就要認識一下了.

對沖又分同市對沖 (Hedging)
或跨市對沖 (Straddle)


同市對沖是指在相同市場內, 做出一買一賣的動作.
而這個動作, 主要是以降低風險為主, 利潤為次.

舉例:

一個期權莊家, 沽出了一個 9 月份以 25000C 點行使價的認購期權
收取了期權金 500 點 (25,000元)

而現時恆生指數為 24000 點.

假如恆生指數到月尾時, 低於 25000 點或 25000 點收市結算.
那麼這個莊家將可賺取全數 500 點期權金.

但如果恆生指數收市結算點數為 25100 點
那麼這個莊家將可賺取全數 400 點期權金.


但如果恆生指數收市結算點數為 25500 點
那麼這個莊家將無利可圖.

因為購入 25000C 點行使價的認購期權者,
其持有的行使價是 25000 點
換言之, 恆生指數收市結算點祇要高於 25000 點
就是行使者所收取的利潤
相反就是莊家的損失.

從上例看到,  恆生指數收市結算點數為 25500 點時
則雙方成和

高於 25500 點, 是認購者的利潤, 也就是莊家的損失

當大市非常波動時, 莊家亦會考慮到風險非常高.
因為一旦指數升上 28000 , 29000, 甚至 30000
莊家的損失便很高了.

莊家所沽出的這個認購期權, 收取了 500 點期權金
在 25500 點是打和, 25500 點以上, 是無限風險.

而又正值大市非常波動, 那麼這個莊家, 就會做出對沖這個行動去降低風險.

如何做法呢 ?

是不是把這個 25000 點行使價的認購期權, 轉而其他莊家呢 ?
當然可以, 這個莊家是可把沽出了的這個期權, 在市場買回相同行使價的認購期權的.

但如此一來, 豈不成了白做, 因為一買一賣也要付出相關費用. (雖然很低)

這個莊家當然不會這樣處理, 這個時候, 他就運用 同市對沖 (Hedging) 了.


怎樣運用法 ?

首先, 要留意上例子裡, 莊家的虧損點是 25500 點以上時, 才會損失.

於是, 他就在期權相同市場, 相同月份.
買入另一個不同行使價的認購期權.

不錯, 他可以買入更高行使價的認購期權

買入行使價 25500c 認購期權

由於 25500c 比他沽出的 25000c 認購期權較為價外
所以這個認購期權的期權金以當時計, 也一定不用 500 點
他可能用 400 點已可購得.


我們現在再計算一下, 恆生指數收市結算點數衹有 3 個結局

1) 不升不跌
2) 跌
3) 升

結局 1

當恆生指數收市結算點數為 25000 點 不升不跌
這位莊家手上沽出及買入的期權同時失去了行使價值
那麼這位莊家收取了 500 點期權金
付出了 400 點期權金

500 - 400 = 100 x 50 元 = 賺 5,000 元 (1張計)


結局 2

當恆生指數收市結算點數為 25000 點以下 跌
這位莊家手上沽出及買入的期權同時失去了行使價值
那麼這位莊家收取了 500 點期權金
付出了 400 點期權金

500 - 400 = 100 x 50 元 = 賺 5,000 元 (1張計)


結局 3
這位莊家手上沽出的認購期權, 要按當時上升指數, 25000 點以上
升了多少賠多少.

但他把風險轉嫁了, 連同收取了的 500 點, 他本該在 25500 點超越時賠上點數價值的
但他買入的期權行使價為 25500 點, 換言之, 在 25500 點以上, 他不必賠了
這是他付出 400 點的對沖價值換回來的.


當恆生指數收市結算點數為 25000 點以上 升
那麼這位莊家收取了 500 點期權金
付出了 400 點期權金
500 - 400 = 100 x 50 元 = 賺 5,000 元 (1張計)


看到了這 3 個結局, 得出一個答案.
這個莊家自己不冒這個風險, 但利潤少了.
而風險亦降低了.

這就是同市對沖的作用


至於跨市對沖 (Straddle)
則由於是牽涉不同市場, 所以又叫跨市對沖

如何跨市對沖法 ?

舉例:

一個期權莊家, 沽出了一個 9 月份以 25000C 點行使價的認購期權
收取了期權金 500 點 (25,000元)

而現時恆生指數為 24000 點.

那麼他祇需做以下動作.

(如同同市對沖例子, 莊家的損失點, 打和點, 及利潤點請參考上述同文.)


立即進入期貨市埸.
注意: 是期貨市埸, 不是期權市場. (進行誇市實例)


現時恆生指數為 24000 點.
9 月期貨指數不計高低水 24000 點
(註一: 高低水另文再述)

那麼這個莊家會留意著指數的去向, 他不必去推測後市.
因為祇有 3 個結局.


1) 不升不跌
2) 跌
3) 升

指數 不升不跌 他不必理會, 等著沒收期權金
指數 跌 他更不必理會, 等著沒收期權金


指數 升 這可要理會一下了, 但他不會太焦急.
因為他沽出的行使認購是 25000 點, 加上 500 點期權金
25500 點以上才虧損.

所以他注意著, 祇有當指數迫近 25500 點時
立即買入跟手上期權同月份的期貨指數一張.

這個動作是抵銷了上升所要賠出的點數.

但當回落時, 則要及時平倉. (這個動作風險極高)


這裡祇是讓大家先有了一個概念.

而接下來, 就再認識一下何謂套戥 (Arbitrage)


套戥雖然幾乎是穩賺不賠, 但都是機構性投資者的動作.
因為需動用的資金成本較大.
但投資者也要有所認識, 可知進退趨避.


先用一個簡單例子:

我們在國內用 100 港元可兌 96.8 人民幣

而在香港找換店用 100 港元可兌 97 人民幣


假如你在國內, 認識一些需要港元的商家.
那麼你就會在香港先用 100 港元兌 97 人民幣
再回到國內用96.8 人民幣 兌 100 港元

這樣子就賺取了 0,2 元差價了.
而你這個動作, 就是在進行套戥.
進入不同的市場, 套取差價, 就叫套戥.


那麼我們看看在金融市場, 又是如何進行套戥.

由於港元與美元掛鉤. 這就造成套戥的好例子.
就以金市來說, 香港的九九金成盤時, 是以國際金價為依歸.
而金價是國際性因素決定的, 不是香港單方面的買賣所能影響.
但九九金在香港是用港元報價, 而外圍金價卻是美元報價.
在時間上就未必能一致, 香港金價折合美元時,
就會比外圍金價上下差了幾港元.
而投資者就有機可乘, 沽出港金買入外圍金. (或相反)
同時進行, 賺取這個因地域性或時間性的價差.


再舉另一套息例子:

例如香港某些因素, 令到利率高於美元.
投資者就可沽美元, 揸港元套取較大息口.
因為有聯繫匯率制度, 匯率並無風險.
但必賺利息.
相同原理, 港息高於美元, 炒金的亦可沽空港金.
買入本地倫敦金, 收取較大港息, 付出較低息口.
這樣就可套息獲利.


好吧, 我們返回股票市場.
前文不是提及期貨指數高水和低水嗎 ?

高水和低水又可稱升水 (Premium)或貼水(Discount).

首先來說一下甚麼是高水.

以期指為例, 高水是指現時期貨指數, 比現貨指數為高, 就叫高水.

例如:

恆生指數現時 25000 點, 而期貨指數 25200 點
比現貨高出了 200 點, 這 200 點就是高出現貨的點數.
而相反, 低於現貨就叫低水, 不管低多少.

好了, 明白沒有 ?

再來就是如何進行套戥了.

要知道買入期貨指數或沽出期貨指數,
假使你中途不平倉, 一直持有到結算日的話.
你手上的期指就會以恆生指數月尾之前的一個交易日.
以當天每 5 分鐘的平均價作基準來計算賺蝕.

即是你在 25000 買入的話, 超越此點數上升則賺, 反之則虧.
同理, 在 25000 沽出的話, 下跌低於此點數則賺, 反之則虧.

而再要知道的是, 甚麼影響恆生指數升跌.

就是成份股, 組成恆生指數的股份, 或稱藍籌股.

知道這些關係之後, 就懂得如何進行套戥了.

當升水時, 立即沽出期貨指數. 買入同等比成份股.

當結算時, 不管大市升跌及任何結局.
結果是穩賺這高出來的點數.

低水則反過來做. 結果亦一樣.


雖然是認識了, 但由於涉及資金不少, 非散戶所能參與.
但這訊息很重要, 對你在期權市場的參考性十分有用